
What’s Coming in Violin Plot 1.3.0
This is a write-up of the new features in violin plot 1.3.0 for interested users. Here's the key changes if you want to skip ahead...
Contents
I recently had to release version 1.2.0 a little early and couldn’t quite cram in everything I wanted. On the plus side it’s now a certified Power BI custom visual, which is a nice personal milestone, and good for anyone who needed the particular bonus functionality that comes with it, as well as assurance that its intentions are legit ;)
I’ve finished adding in the new stuff, so it’s time for an update! As usual, the listing in AppSource is showing the new version number and notes, but it’ll take a couple of weeks for the visuals team to do their final testing and release it proper.
Update (2019-06-25): Now live!
If you are using this through the organization custom visuals mechanism, you can download the 1.3.0 version of the visual from the repository’s downloads page in the meantime.
At a high level, the main changes are:
- Revised Legend
- Column (Min/Max) Combo Plot
- KDE (Violin) Plot Clamping
- Y-Axis Start and End
- Barcode Plot Tooltip — Number of Points
- Violin Stroke Width
Please read on if you wish to delve into the detail a bit more.
Revised Legend
Another great idea from Meagan Longoria’s write up was a legend of her own design, which was a way of providing a quick overview of some of the statistical annotations of the chart (such as mean and median) for the uninitiated. I’ve drawn some inspiration from that and added this into the visual as part of its existing legend functionality:
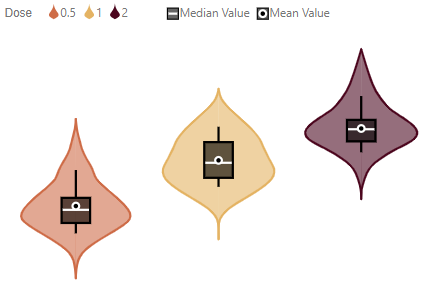
- Configuration for the new changes can be found in the Legend property menu.
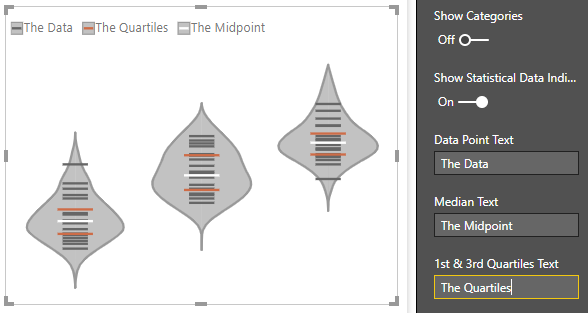
- Categories can be enabled or disabled by toggling the Show Categories property.
- The Show Statistical Indicators property allows you to toggle the display of any indicators such as mean, median and quartiles (plus individual data point if you’ve got the barcode plot enabled).
- If your combo plot shows quartiles, the indicator will be consolidated if they have the same formatting, otherwise you’ll get one for the 1st quartile and another for the 3rd quartile.
- Additionally, the text for any displayed statistical indicators can be customised, just in case the defaults are not suitable for your scenario, e.g.:
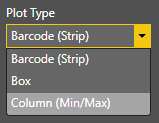
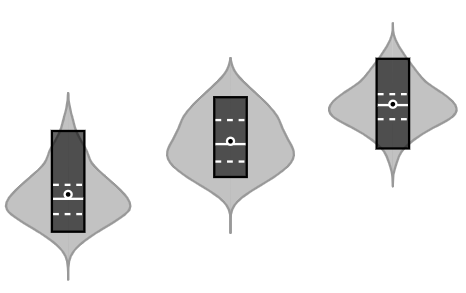
Column (Min/Max) Combo Plot
There’s a new combo plot on the block, available from the Plot Type property in the Combo Plot menu:
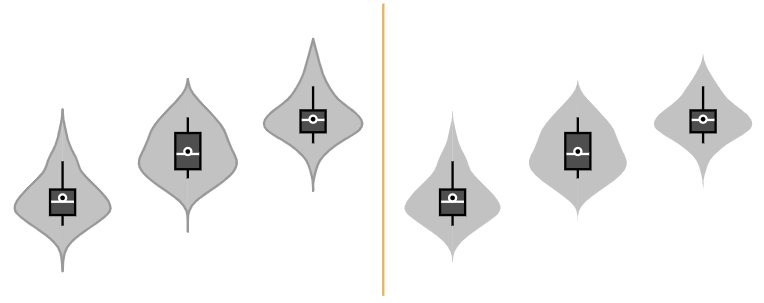
Here’s an example of what this selecting this Plot Type looks like for the tooth growth dataset:
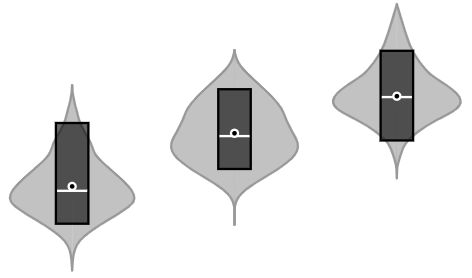
As per the box plot, the default view includes the mean and the median. You can also toggle the display of the quartiles, e.g.:
Quartiles are configurable in much the same way as for the barcode plot, i.e. you can specify Line Color, Stroke Width and Line Style for each one.
KDE Plot Clamping
This question in the Power BI Community forums had asked about the run-off or “tail” produced by the KDE plot and how it can extend well beyond normal ranges in some cases. This is a feature of the KDE plot and the parameters used to generate it, such as bandwidth.
If you wish to limit the range of the KDE plot to the extent of the data, you can now enable the Clamp to Min/Max property in the Violin Options menu, e.g.:
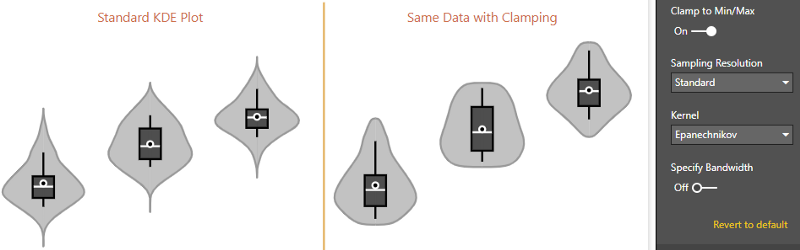
Please bear in mind that while this may be desirable for your particular use case, sharply cutting the KDE plot when it cannot hit these confines naturally may hide insights about the modality (shape) of your data. As such, it is disabled by default.
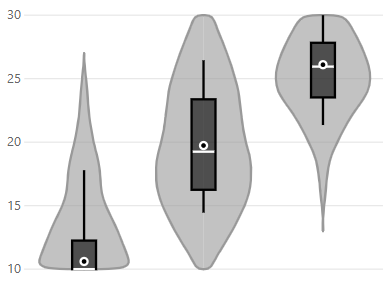
Y-Axis Start and End
To bring the visual in-line with the behaviour of other cartesian charts, the Y-Axis property menu now allows you to specify Start and End values for your chart.
Behaviour against the KDE plot portion works very much like clamping, detailed above — if your KDE plot exceeds either boundary, the KDE plot will be truncated in a similar way, e.g.:
While this probably goes without saying, note that there is no active filtering, so all statistics and plots will retain the dataset passed to the visual from Power BI and calculate as if the Start and End properties are not set. This means that statistics and KDE plots are inclusive, even if the plotted range may not be fully visible.
Barcode Plot Tooltip — Number of Points
When using the barcode plot, you might have a large data set with a very low number of distinct values. For example, if we have a 30K dataset with a rating out of 5, starting at 0.5 with intervals of 0.5, then you get a maximum of 10 unique values, e.g.:
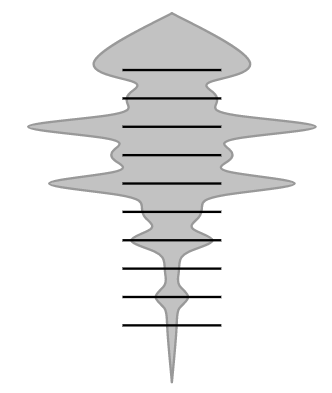
While we can see the distribution, it might be nice to know how many values there are at each point. The tooltip will now display this as # Samples with Highlighted Value for the barcode plot, e.g.:
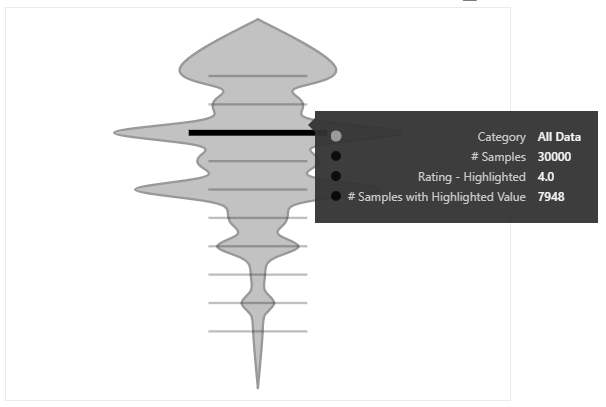
The formatting of this value is tied to the # Samples Display Units in the Default Tooltip Details menu, so both will behave consistently to each other.
As an aside, datasets like this highlighted potential performance issues, where we would be rendering the line for each data point. In this new version we now only render unique values so for the example above, this is only 10 shapes instead of 30,000. Not all datasets will receive the same benefit, but every little helps!
Violin Stroke Width
A minor enhancement, but the Stroke Width property in the Violin Options menu can now be set to 0. This allows you to use the hide the KDE plot line if you just want to work with the Transparency setting in the Data Colors menu, e.g.:
As always, thanks so much for the feedback and support, and I hope you continue to find the visual useful. Now, time to start work on 1.4!