Tag violinplot
Farewell SMLC, hello HTML Content (and maybe something else...)
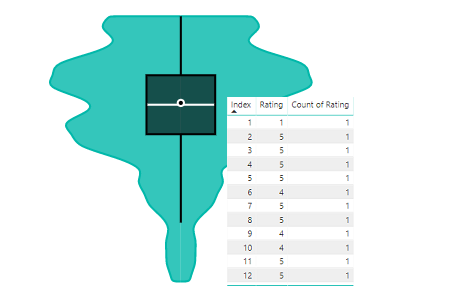
How to correctly structure your data for using the Violin Plot (and a general lesson about aggregation within Power BI).
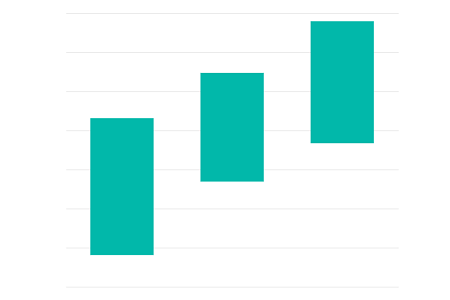
How we can work with the properties of the Violin Plot custom visual for Power BI to produce a simple range column chart.
Overview of changes coming in version 1.3.0 of the Violin Plot custom visual for Power BI.
Tag dataviewmappings
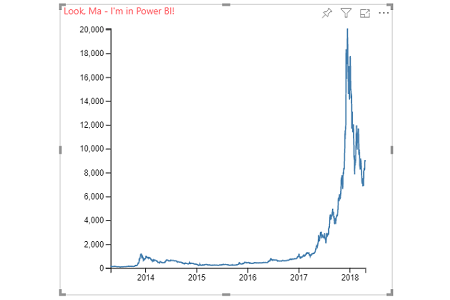
Taking an existing example for d3.js and applying to it Power BI as a custom visual. Part 2 handles the visual elements of our chart.
Taking an existing example for d3.js and applying to it Power BI as a custom visual. Part 1 handles mapping from the dataView into our custom visual.
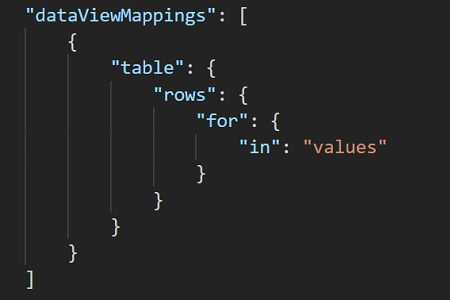
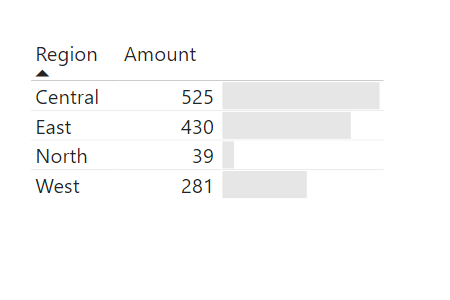
How to set up and work with a simple `table` DataViewMapping in the Power BI custom visuals SDK.
Tag capabilities
Taking an existing example for d3.js and applying to it Power BI as a custom visual. Part 2 handles the visual elements of our chart.
Taking an existing example for d3.js and applying to it Power BI as a custom visual. Part 1 handles mapping from the dataView into our custom visual.
How to set up and work with a simple `table` DataViewMapping in the Power BI custom visuals SDK.
Tag table
Options for hiding a column heading in Power BI tables and matrices in situations where it might be redundant.
How to set up and work with a simple `table` DataViewMapping in the Power BI custom visuals SDK.
Tag dataroles
How to correctly structure your data for using the Violin Plot (and a general lesson about aggregation within Power BI).
Taking an existing example for d3.js and applying to it Power BI as a custom visual. Part 2 handles the visual elements of our chart.
Taking an existing example for d3.js and applying to it Power BI as a custom visual. Part 1 handles mapping from the dataView into our custom visual.
How to set up and work with a simple `table` DataViewMapping in the Power BI custom visuals SDK.
Tag node
A short overview of how the custom visuals SDK looks for the developer.
Tag pbiservice
A short overview of how the custom visuals SDK looks for the developer.
A short overview of how the custom visuals SDK looks for the developer.
Tag certificate
A short overview of how the custom visuals SDK looks for the developer.
Tag range
How we can work with the properties of the Violin Plot custom visual for Power BI to produce a simple range column chart.
Tag columnchart
How we can work with the properties of the Violin Plot custom visual for Power BI to produce a simple range column chart.
Tag categorical
Taking an existing example for d3.js and applying to it Power BI as a custom visual. Part 2 handles the visual elements of our chart.
Taking an existing example for d3.js and applying to it Power BI as a custom visual. Part 1 handles mapping from the dataView into our custom visual.
Tag d3
Taking an existing example for d3.js and applying to it Power BI as a custom visual. Part 2 handles the visual elements of our chart.
Taking an existing example for d3.js and applying to it Power BI as a custom visual. Part 1 handles mapping from the dataView into our custom visual.
Tag sampling
How to correctly structure your data for using the Violin Plot (and a general lesson about aggregation within Power BI).
Tag grain
How to correctly structure your data for using the Violin Plot (and a general lesson about aggregation within Power BI).
Tag smlc
Farewell SMLC, hello HTML Content (and maybe something else...)
The latest version of the Small Multiple Line Chart custom visual is now live in the marketplace and finally certified 😊
Overview of changes coming in version 2.0.0 of the Small Multiple Line Chart custom visual for Power BI.
Tag smallmultiples
Farewell SMLC, hello HTML Content (and maybe something else...)
The latest version of the Small Multiple Line Chart custom visual is now live in the marketplace and finally certified 😊
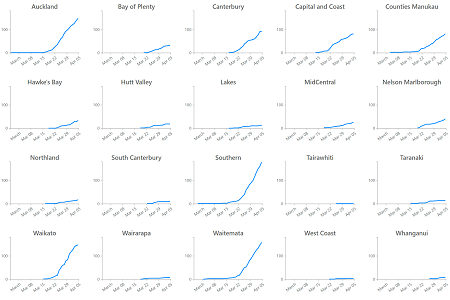
Using Charticulator or the Charts.PowerBI.Tips tool to build our own Power BI custom visuals with small multiples.
Overview of changes coming in version 2.0.0 of the Small Multiple Line Chart custom visual for Power BI.
Tag matrix
Options for hiding a column heading in Power BI tables and matrices in situations where it might be redundant.
Tag powerbi
Options for hiding a column heading in Power BI tables and matrices in situations where it might be redundant.
Tag unicode
Options for hiding a column heading in Power BI tables and matrices in situations where it might be redundant.
Tag html
Minor updates to both the standard and certified editions of the Power BI custom visual.
Certification has passed and this update is on its way to your reports shortly.
We're not quite live yet, but 1.4 represents the biggest update in quite some time, and hopefully there's fun to be had.
Presenting: a less permissive version of HTML Content... but with certification privileges.
Improving the official HTML Content visual documentation, a little bit at a time.
Farewell SMLC, hello HTML Content (and maybe something else...)
Tag htmlcontent
Minor updates to both the standard and certified editions of the Power BI custom visual.
Certification has passed and this update is on its way to your reports shortly.
We're not quite live yet, but 1.4 represents the biggest update in quite some time, and hopefully there's fun to be had.
Presenting: a less permissive version of HTML Content... but with certification privileges.
Improving the official HTML Content visual documentation, a little bit at a time.
Farewell SMLC, hello HTML Content (and maybe something else...)
Tag deneb
Deneb 1.6 alpha testing has finished and we're ready to move things forward.
Deneb 1.6 has a lot of new features and improvements, and the alpha builds are available for testing.
As Deneb has been GA in AppSource for a year, I thought it'd be a good time to catch-up!
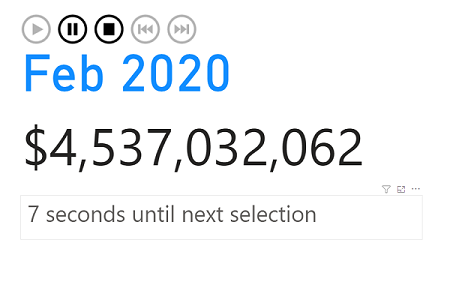
Using the flexibility of Vega events to indicate when a Play Axis will next refresh.
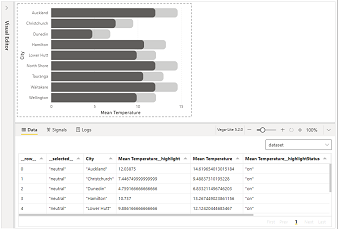
Using luminance of a colour can be a neat trick to help produce a suitably contrasting colour.
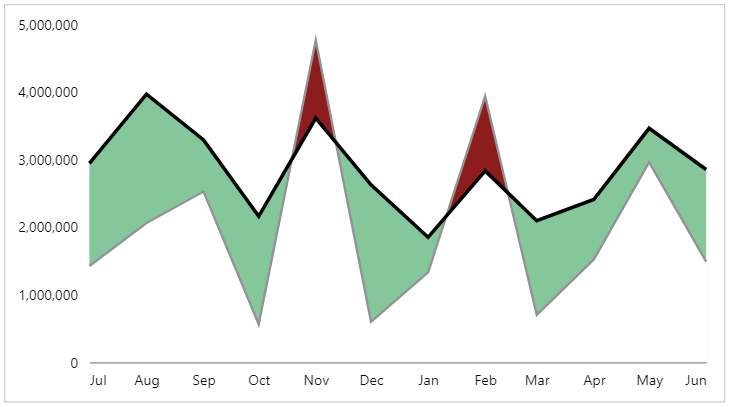
These are very useful plots, but they come with some tricky requirements to get the shaded areas exactly right...
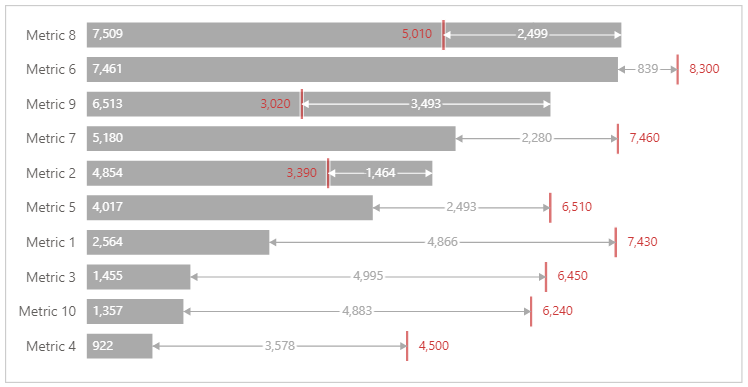
Reproducing Robert Mundigl's variations on bullet charts using Deneb and Vega-Lite.
Deneb 1.3 is now generally available in AppSource. Here's a rundown on what's new, and what's happening next.
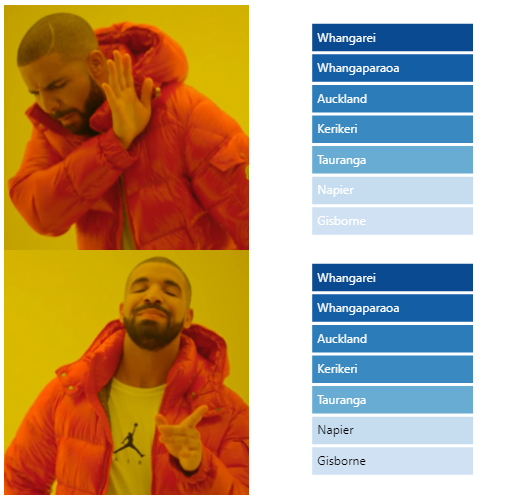
When Personalize Visuals is too personalized: an experiment in switching displayed charts using a dimension attribute.
An update to the initial 1.3 beta has been issued following testing feedback from users.
The 1.3. beta is available for download for validation and feedback prior to AppSource submission.
The 1.1. beta is available for download for validation and feedback prior to AppSource submission.
The Alpha Channel Build is a means of being able to test and feed back on changes as soon as they are made rather than waiting for AppSource releases.
It's been a while since we've had an update, so... here's an update.
Progress update for Jan 2021 on "Deneb", including some new changes that are moving towards improving integration with Power BI.
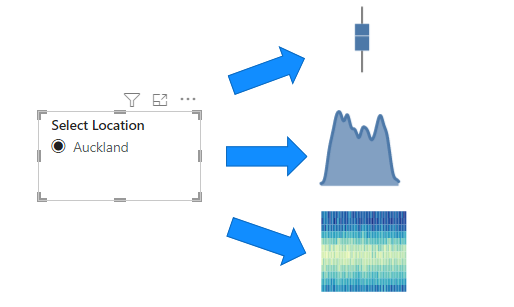
"Deneb" is a prototyping effort, that will ideally bring the Vega visualisation grammar system to Power BI as a custom visual.
Farewell SMLC, hello HTML Content (and maybe something else...)
Tag vega
Deneb 1.6 alpha testing has finished and we're ready to move things forward.
Deneb 1.6 has a lot of new features and improvements, and the alpha builds are available for testing.
As Deneb has been GA in AppSource for a year, I thought it'd be a good time to catch-up!
Using the flexibility of Vega events to indicate when a Play Axis will next refresh.
Using luminance of a colour can be a neat trick to help produce a suitably contrasting colour.
These are very useful plots, but they come with some tricky requirements to get the shaded areas exactly right...
Reproducing Robert Mundigl's variations on bullet charts using Deneb and Vega-Lite.
Deneb 1.3 is now generally available in AppSource. Here's a rundown on what's new, and what's happening next.
An update to the initial 1.3 beta has been issued following testing feedback from users.
The 1.3. beta is available for download for validation and feedback prior to AppSource submission.
The 1.1. beta is available for download for validation and feedback prior to AppSource submission.
The Alpha Channel Build is a means of being able to test and feed back on changes as soon as they are made rather than waiting for AppSource releases.
It's been a while since we've had an update, so... here's an update.
Progress update for Jan 2021 on "Deneb", including some new changes that are moving towards improving integration with Power BI.
"Deneb" is a prototyping effort, that will ideally bring the Vega visualisation grammar system to Power BI as a custom visual.
Farewell SMLC, hello HTML Content (and maybe something else...)
Tag coffee
Farewell SMLC, hello HTML Content (and maybe something else...)
Tag course
Farewell SMLC, hello HTML Content (and maybe something else...)
Tag vega-lite
Deneb 1.6 alpha testing has finished and we're ready to move things forward.
Deneb 1.6 has a lot of new features and improvements, and the alpha builds are available for testing.
As Deneb has been GA in AppSource for a year, I thought it'd be a good time to catch-up!
Using luminance of a colour can be a neat trick to help produce a suitably contrasting colour.
These are very useful plots, but they come with some tricky requirements to get the shaded areas exactly right...
Reproducing Robert Mundigl's variations on bullet charts using Deneb and Vega-Lite.
Deneb 1.3 is now generally available in AppSource. Here's a rundown on what's new, and what's happening next.
When Personalize Visuals is too personalized: an experiment in switching displayed charts using a dimension attribute.
An update to the initial 1.3 beta has been issued following testing feedback from users.
The 1.3. beta is available for download for validation and feedback prior to AppSource submission.
The 1.1. beta is available for download for validation and feedback prior to AppSource submission.
The Alpha Channel Build is a means of being able to test and feed back on changes as soon as they are made rather than waiting for AppSource releases.
It's been a while since we've had an update, so... here's an update.
Tag bullet-chart
Reproducing Robert Mundigl's variations on bullet charts using Deneb and Vega-Lite.
Tag line-chart
These are very useful plots, but they come with some tricky requirements to get the shaded areas exactly right...
Tag playaxis
Using the flexibility of Vega events to indicate when a Play Axis will next refresh.