
Building a dynamic countdown in Power BI with Deneb & Vega
I got asked today if it was possible to use the HTML Content visual to display a countdown in a Power BI report, where the countdown would indicate how long until the Play Axis visual was going to do its next selection.
For those not in the know, the Play Axis is a visual that you can add a column to, and this will sequentially slice the report page based on an interval that you configure in that visual’s properties. So, the idea was to be able to provide a little extra feedback on the page as to when the next slice would be likely to occur.
I thought about the problem for a bit, and while it’s possible to do something like this in HTML and JavaScript, I don’t really support JavaScript in the HTML Content visual, and I probably won’t. Some people may have figured out a way of adding it, and that’s fine if it works for them… it just requires a lot of support and functionality that I don’t have the free time to dedicate to supporting how I would like it to work in the visual.
But… I like solving problems!
So, I started thinking that this is probably an easy job using Deneb and Vega. I tend to work with and blog about Vega-Lite, but you can do a lot more with Vega, if you’re willing to put in the work. Vega has Event Streams as part of its language, which are a mixture of things that tie to the underlying browser, and some of the things happening inside the Vega view, and this is how we can build some functionality based on timer events in the current page.
So, if you’ve been putting off looking at Vega, this post can give you a very simple intro to some of the concepts.
Report setup
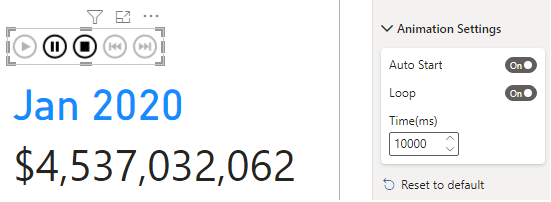
I’ve set up a simple report page to illustrate this example. We have a Play Axis that’s been set up to Auto Start, Loop and have a Time of 10,000 ms (10 seconds). This will cycle through a simple multi-row card that shows sales by month, e.g.:
Approaching the Vega specification
Our approach for how we’ll use Vega to display a timer is as follows:
- Define our interval, which will match the interval of the Play Axis.
- Calculate the reference time for the current slicer column.
- Calculate our counter value, based on the difference from the current time to the reference time. This will be updated using a timer.
- Calculate the display text, based on this value.
- Create a text mark to display the text.
Because our logic is evaluated based on timer events, we can ensure that the text mark is updated with the correct values. And, when the Play Axis performs its next filter, the Deneb visual will be updated and start counting down again.
Adding Deneb and a measure
We’ll start by adding the Deneb visual to our report canvas and assigning it a measure so that there is some data. This can be anything from your report, as we’re not going to use it (it’s just that Deneb requires some data so that you can start editing). I personally just use something like the following:
Dummy =
BLANK ()
As you can see, it is a most exciting measure 🙂
Creating the initial specification
With some ‘data’, we’ll now click on the visual header and select Edit to open the advanced editor. In the Create New Specification dialog, we’ll chose Vega and Empty as our template, e.g.:
Click the Create button, and this will present you with the editor, e.g.:
Creating the interval and reference time
In our specification, we’ll add a signals property (which is an array), and two initial entries, e.g.:
1
2
3
4
5
6
7
8
9
10
11
12
13
14
{
  "data": [{ "name": "dataset" }],
  "signals": [
    {
      "name": "interval",
      "init": "10000"
    },
    {
      "name": "startTime",
      "init": "now()"
    }
  ],
  "marks": []
}
Here, we’ve added:
- A signal named
interval, which has an initial value of10000(which will match the interval of our Play Axis slicer). - A signal named
startTime, which captures the time the visual last updated.
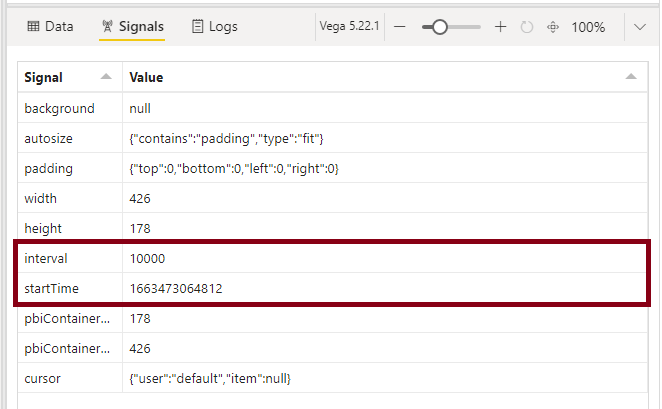
We can inspect the values of these signals using the Signals tab in the Debug pane, e.g.:
Adding and updating the counter value
Now that we have the start time and the interval, we can write logic to take them into account and this will handle the lion’s share of what we want the countdown to do. Add the following to the signals array in the specification:
1
2
3
4
5
6
7
8
9
10
11
12
13
14
15
16
17
18
19
20
{
  ...
  "signals": [
    ...
    {
      "name": "counter",
      "init": "interval",
      "on": [
        {
          "events": {
            "type": "timer",
            "throttle": 10
          },
          "update": "round((interval - (now() - startTime))/1000)"
        }
      ]
    }
  ],
  ...
}
Here, we’ve added a new signal named counter, which will run every 10ms, and update its own value with the following logic:
- Calculate the difference in milliseconds between the current time and the
startTime). - Subtract this from the
intervalvalue (because we are counting down). - Divide this by 1,000 (to get seconds).
- Round this to the nearest whole number.
As we’re doing a very simple countdown, it makes sense to calculate whole seconds at this point, but you could keep as milliseconds and use more logic in the presentation part of the specification.
When we apply our changes, we can now see the counter signal in the Signals tab, and that it changes to a new value every 1 second or so, e.g.:
In the above example, the Play Axis slicer is still affecting our visual (even though Deneb is in focus mode), so the
startTimevalue is also updating. You may wish to disable the Play Axis temporarily if this is something you’d prefer not to happen.
Calculating the display text
We’ll ad one more signal to the array, which will handle the simple display logic for our text mark:
1
2
3
4
5
6
7
8
9
10
11
{
  ...
  "signals": [
    ...
    {
      "name": "seconds",
      "update": "counter + ' second' + (counter == 1 ? '' : 's')"
    }
  ],
  ...
}
This creates a signal called seconds, which simply creates the value, ‘n seconds’ (if counter is anything other than 1), or ‘n second’ (if counter == 1).
We can now inspect the Signals tab again, and see this value updating too, e.g.:
This is a very simple example, but hopefully gives you an idea as to how you can think about conditional formatting logic in your expressions.
We now just have to take care of the display portion of our specification.
Creating the text mark
Our visual is just going to have a simple text mark, which displays the seconds value, so we’ll set this up. We’ll now add an entry to the marks array, e.g.:
1
2
3
4
5
6
7
8
9
10
11
12
13
14
15
16
17
18
19
20
21
22
{
  ...
  "marks": [
    {
      "type": "text",
      "encode": {
        "enter": {
          "x": {"value": 10},
          "y": {"signal": "height/2"},
          "baseline": {
            "value": "middle"
          }
        },
        "update": {
          "text": {
            "signal": "seconds"
          }
        }
      }
    }
  ]
}
With Vega, all properties are done in the encode channel, so the key things to think about are that:
- The
enterproperty dictates what should be done when the mark is drawn for the first time. - The
updateproperty dictates what should be done when the mark receives updates.
These concepts are covered in more detail in Vega’s marks documentation.
To summarise what we’re assigning here:
- Horizontally position the mark 10 pixels from the left (x).
- Vertically position the mark in the centre.
- Ensure the text baseline is in the middle also.
- Supply the
secondsvalue each time the update runs.
In the Config pane, I’m just going to add some cosmetic styling to the text mark:
1
2
3
4
5
6
7
{
  "text": {
    "font": "Segoe UI",
    "fontSize": 16,
    "fill": "#605E5C"
  }
}
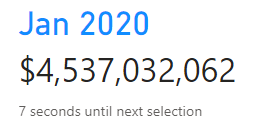
When we apply our changes, we now get something that will be visible to our user, e.g.:
It’s probably a good time to check and review how things are looking on the report.
Reviewing our specification on the canvas
We can now save our changes, go back to the report canvas, and resize and position our visual so that’s where we want it, e.g.:
We can see that the multi-row card, and the simple timer we’ve built refresh when the Play Axis moves on to its next filter context. This is a fairly rudimentary visual, but hopefully illustrates some of the basic concepts of Vega and its event handling without being too complex for the uninitiated.
We could also hide the Play Axis from the canvas at this point if we so wished.
A quick improvement after review
Having seen this in situ, I’m just going to make a small change to the seconds signal so that it’s a bit more obvious what this means to the reader:
1
2
3
4
5
6
7
8
9
10
11
{
  ...
  "signals": [
    ...
    {
      "name": "seconds",
      "update": "counter + ' second' + (counter == 1 ? '' : 's') + ' until next selection'"
    }
  ],
  ...
}
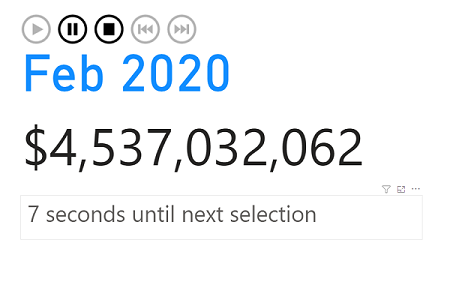
I’ve also set the x-position of the mark to zero, so that it lines up with the card, but that’s just a personal preference. However, this now makes a bit more sense when viewed on the canvas, e.g.:
seconds signal, our compact visual makes a bit more sense on the canvas.Complete recipe
Putting everything together, our specification looks as follows:
1
2
3
4
5
6
7
8
9
10
11
12
13
14
15
16
17
18
19
20
21
22
23
24
25
26
27
28
29
30
31
32
33
34
35
36
37
38
39
40
41
42
43
44
45
46
47
48
49
50
51
52
53
54
55
56
{
  "data": [{ "name": "dataset" }],
  "signals": [
    {
      "name": "interval",
      "init": "10000"
    },
    {
      "name": "startTime",
      "init": "now()"
    },
    {
      "name": "counter",
      "init": "interval",
      "on": [
        {
          "events": {
            "type": "timer",
            "throttle": 10
          },
          "update": "round((interval - (now() - startTime))/1000)"
        }
      ]
    },
    {
      "name": "seconds",
      "update": "counter + ' second' + (counter == 1 ? '' : 's') + ' until next selection'"
    }
  ],
  "marks": [
    {
      "type": "text",
      "encode": {
        "enter": {
          "x": { "value": 0 },
          "y": { "signal": "height/2" },
          "baseline": {
            "value": "middle"
          }
        },
        "update": {
          "text": {
            "signal": "seconds"
          }
        }
      }
    }
  ],
  "config": {
    "text": {
      "font": "Segoe UI",
      "fontSize": 16,
      "fill": "#605E5C"
    }
  }
}
I’ve been tempted to produce something quite elaborate, as once the problem is solved there’s all kinds of places you can take the design. However, I’ll leave all that fun stuff up to you. I hope that this use case might have a place in your report writing, and if not, then it may at least expose you to some more of Vega’s functionality.
Thanks as always for reading,
DM-P