Making a Range Column Chart in Power BI with the Violin Plot Custom Visual
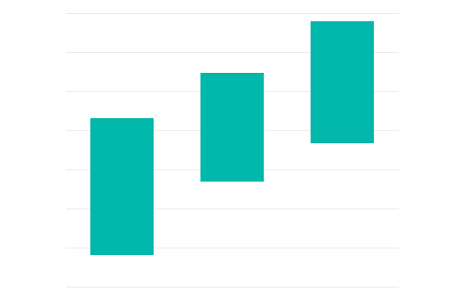
How we can work with the properties of the Violin Plot custom visual for Power BI to produce a simple range column chart.
1 post · All tags
How we can work with the properties of the Violin Plot custom visual for Power BI to produce a simple range column chart.