"Out of One, Many", or: Making Switchable Charts in Power BI with Deneb
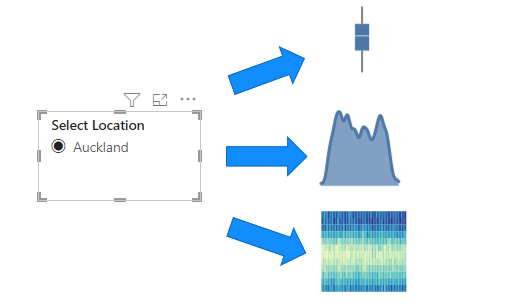
When Personalize Visuals is too personalized: an experiment in switching displayed charts using a dimension attribute.
3 posts · All categories
When Personalize Visuals is too personalized: an experiment in switching displayed charts using a dimension attribute.
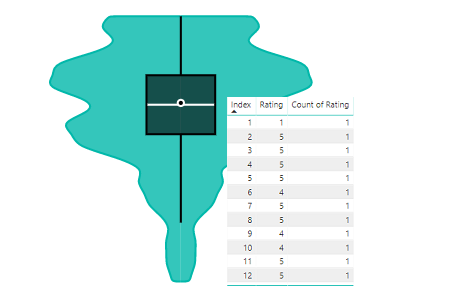
How to correctly structure your data for using the Violin Plot (and a general lesson about aggregation within Power BI).
How we can work with the properties of the Violin Plot custom visual for Power BI to produce a simple range column chart.