Lifting and Shifting a Simple d3.js Line Chart into A Power BI Custom Visual (Part 2)
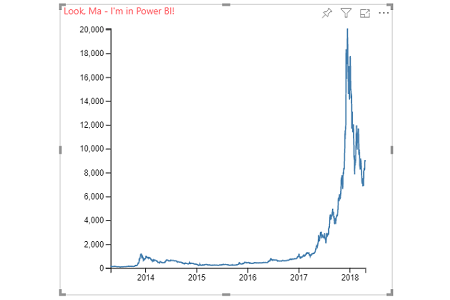
Taking an existing example for d3.js and applying to it Power BI as a custom visual. Part 2 handles the visual elements of our chart.
2 posts · All categories
Taking an existing example for d3.js and applying to it Power BI as a custom visual. Part 2 handles the visual elements of our chart.
Taking an existing example for d3.js and applying to it Power BI as a custom visual. Part 1 handles mapping from the dataView into our custom visual.