No-Code Custom Visuals with Small Multiples
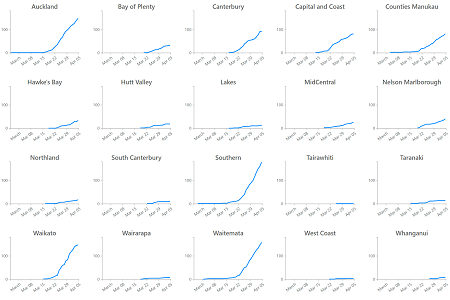
Using Charticulator or the Charts.PowerBI.Tips tool to build our own Power BI custom visuals with small multiples.
4 posts · All categories
Using Charticulator or the Charts.PowerBI.Tips tool to build our own Power BI custom visuals with small multiples.
Taking an existing example for d3.js and applying to it Power BI as a custom visual. Part 2 handles the visual elements of our chart.
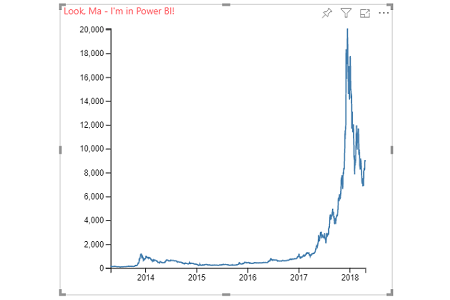
Taking an existing example for d3.js and applying to it Power BI as a custom visual. Part 1 handles mapping from the dataView into our custom visual.
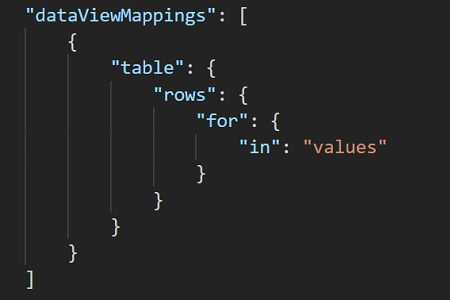
How to set up and work with a simple `table` DataViewMapping in the Power BI custom visuals SDK.