State of (My) Visuals - Dec 2020
Farewell SMLC, hello HTML Content (and maybe something else...)

4 posts · All tags
Farewell SMLC, hello HTML Content (and maybe something else...)
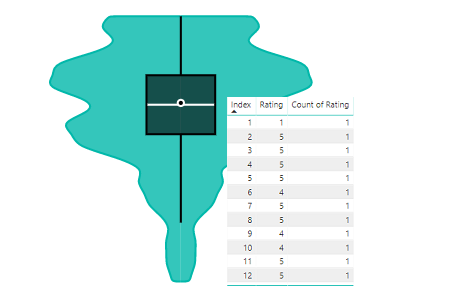
How to correctly structure your data for using the Violin Plot (and a general lesson about aggregation within Power BI).
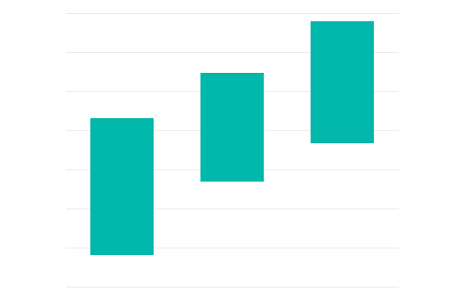
How we can work with the properties of the Violin Plot custom visual for Power BI to produce a simple range column chart.
Overview of changes coming in version 1.3.0 of the Violin Plot custom visual for Power BI.