Lifting and Shifting a Simple d3.js Line Chart into A Power BI Custom Visual (Part 1)
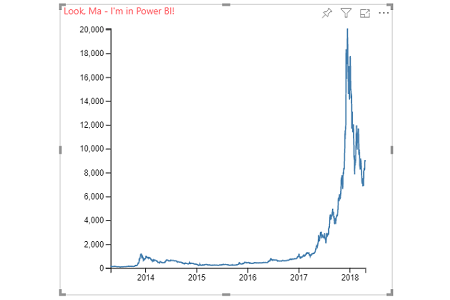
Taking an existing example for d3.js and applying to it Power BI as a custom visual. Part 1 handles mapping from the dataView into our custom visual.
Custom visuals, the visuals SDK, and Power BI development.
Taking an existing example for d3.js and applying to it Power BI as a custom visual. Part 1 handles mapping from the dataView into our custom visual.
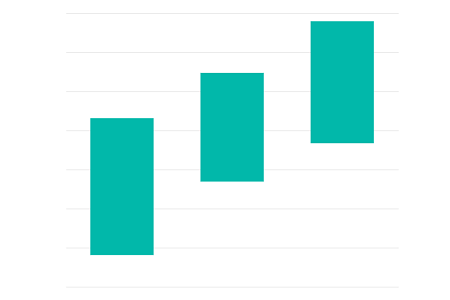
How we can work with the properties of the Violin Plot custom visual for Power BI to produce a simple range column chart.
A short overview of how the custom visuals SDK looks for the developer.

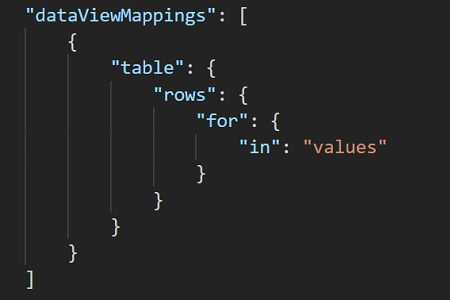
How to set up and work with a simple `table` DataViewMapping in the Power BI custom visuals SDK.
Overview of changes coming in version 1.3.0 of the Violin Plot custom visual for Power BI.