"Deneb" Prototype Dev Log: 0.1.0.60
"Deneb" is a prototyping effort, that will ideally bring the Vega visualisation grammar system to Power BI as a custom visual.
Custom visuals, the visuals SDK, and Power BI development.
"Deneb" is a prototyping effort, that will ideally bring the Vega visualisation grammar system to Power BI as a custom visual.
Farewell SMLC, hello HTML Content (and maybe something else...)

The latest version of the Small Multiple Line Chart custom visual is now live in the marketplace and finally certified 😊
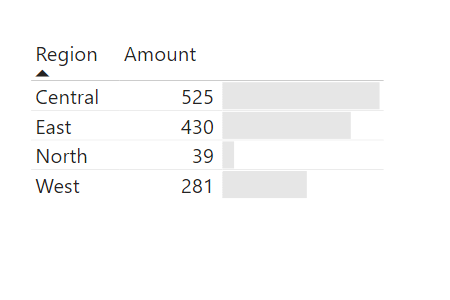
Options for hiding a column heading in Power BI tables and matrices in situations where it might be redundant.
Using Charticulator or the Charts.PowerBI.Tips tool to build our own Power BI custom visuals with small multiples.
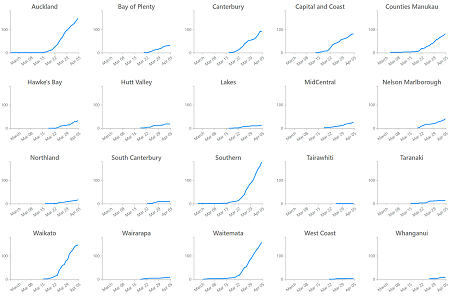
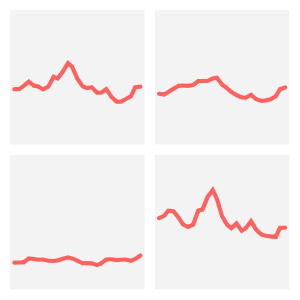
Overview of changes coming in version 2.0.0 of the Small Multiple Line Chart custom visual for Power BI.
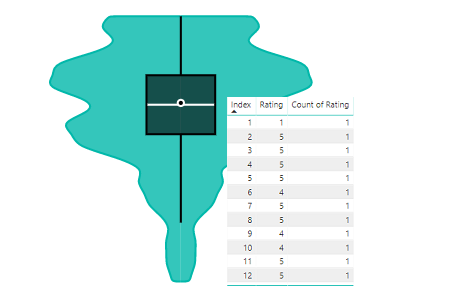
How to correctly structure your data for using the Violin Plot (and a general lesson about aggregation within Power BI).
Taking an existing example for d3.js and applying to it Power BI as a custom visual. Part 2 handles the visual elements of our chart.
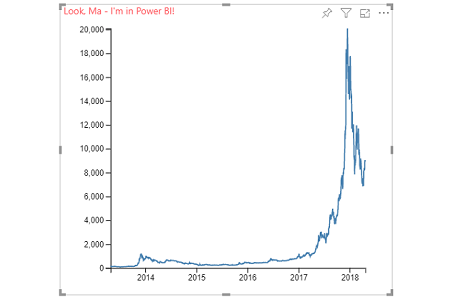
Taking an existing example for d3.js and applying to it Power BI as a custom visual. Part 1 handles mapping from the dataView into our custom visual.
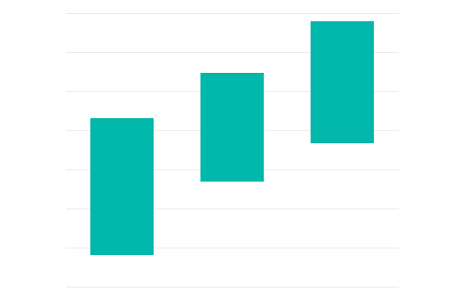
How we can work with the properties of the Violin Plot custom visual for Power BI to produce a simple range column chart.